Dashboard
KPIs, consent trends, recommendations, quick actions, and recent logs for your active property.
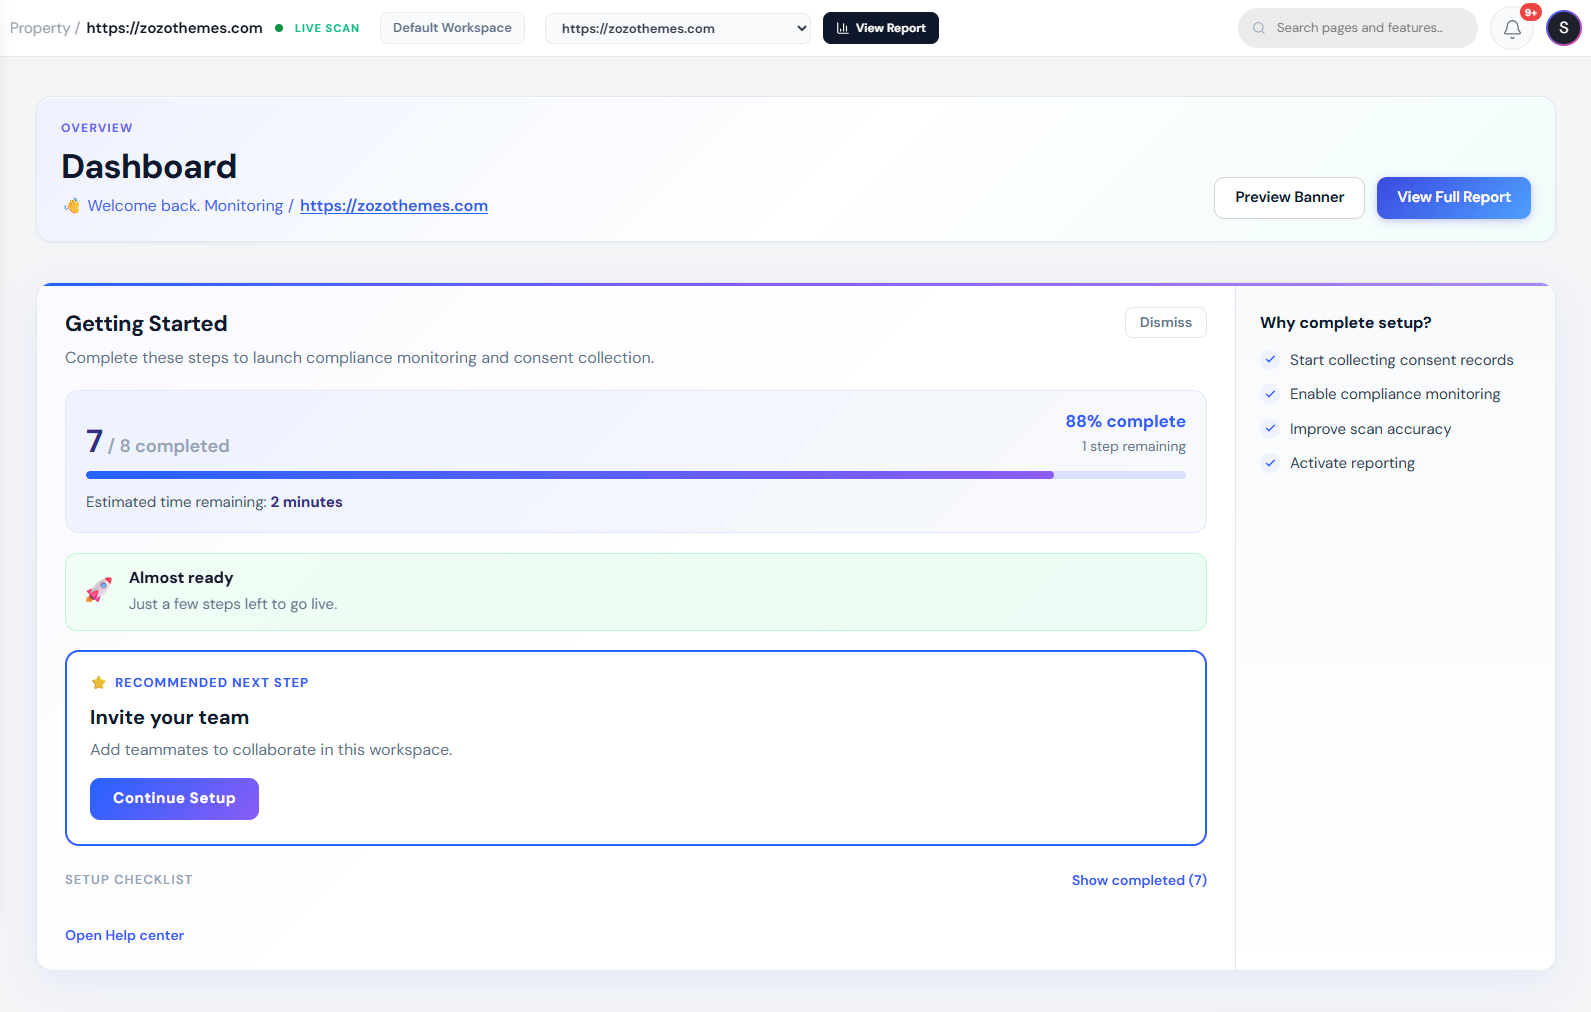
The Dashboard (/dashboard) is your daily operations view for the selected property in the header.
Why it matters
| Audience | Use |
|---|---|
| Marketing | Consent rate and trend |
| Compliance | Scan score and recommendations |
| Engineering | Scan status and rescan shortcuts |
Header actions
| Control | Action |
|---|---|
| Preview Banner | → Consent Setup |
| View Full Report | → Scanner / cookie compliance view |
Onboarding checklist
When visible, tracks workspace setup via API checklist:
- Configure settings
- Add website
- Run scan
- Publish banner
- Install modules
- Review compliance
- Add translations
Dismiss per workspace when complete.
KPI cards
| Card | Data source | Notes |
|---|---|---|
| Total Websites | Workspace count | Not property-scoped |
| Scan Status | Crawl progress / completed count | “Live” indicator in shell is decorative |
| Consent Rate | Accepted ÷ (accepted + rejected) | Empty until banner live |
| Scan-derived score | Latest crawl heuristic | Not legal certification—tooltip in UI |
Each card includes trend styling and progress bar animation.
Charts
Consent Breakdown donut
Segments: Accepted, Partial, Rejected, Customized (when data exists).
Usage Trends (7 days)
Line chart: total events vs accepted—requires deployed banner.
Cookies by Category
Horizontal bar chart from scan categories: Analytics, Marketing, Preferences, Essential/Necessary, Unclassified.
Smart Recommendations
Up to three cards from recommendations API (optional AI):
| Severity | Typical action |
|---|---|
| Critical / Warning | Fix now → Consent Setup |
| Info | Review link |
View all → Compliance hub.
Quick actions
| Tile | Destination | Hint text |
|---|---|---|
| Rescan Domain | Scanner | Last scan time |
| Export PDF | Compliance | Scan & consent summary |
| Integration | Consent Setup | API & webhooks wording |
| Alerts | Consent logs | Row-level audit |
Cookie summary strip
| Field | Meaning |
|---|---|
| Total cookies | From latest scan |
| Pages scanned | Crawl coverage |
| Last scan | Timestamp |
| Duration | Crawl length |
Label UPDATED LIVE on summary.
Recent consent logs
Table: ID, Action, Timestamp (10 rows). VIEW ALL DATA → full Consent logs page.
Click row for detail modal when enabled (full i18n fields).
Workflows
Daily monitoring (5 minutes)
- Confirm property selector.
- Check consent rate + trend.
- Open critical recommendation if any.
- Glance scan score change vs last week.
Post-deploy verification
- Run quick action Rescan Domain.
- Compare cookie summary totals.
- Confirm trend receives new events within 24h.
FAQ
Why is consent rate zero?
No live banner events yet—verify Modules install and traffic.
Why do website KPIs differ from Dashboard?
Some cards are workspace-wide (website count); charts are property-scoped.